
Soil Geochemistry Confirms Large Porphyry System at Copper Springs in the Arizona Copper Triangle - Coyote Copper Mines Expands Land Package by 2,000 Acres
Toronto, Ontario--(Newsfile Corp. - August 5, 2026) - Coyote Copper Mines Inc. (TSXV: CCMM) ("CCMM" or the "Corporation") is pleased to report the results of its Phase 1 and Phase 2 soil geochemistry program at the Copper Springs Project, located in Arizona's prolific Copper Triangle. The program has delivered exceptionally strong copper ("Cu") and molybdenum("Mo") anomalies, validating the large-scale 3D spectral IP inversion of CSEM-MT geophysical "donut" features announced on May 12, 2026.
In response to these results, CCMM has staked an additional 2,000 acres, increasing its total land position to 774 BLM mining claims. This encompasses approximately 16,000 acres (6,475 hectares or 65km2) of prime copper lands in Arizona.
CEO Dan Weir commented: "Both the copper and the molybdenum values were consistently much higher than we expected, outlining large anomalous zones. The soil samples also show the incredible potential of the Central Zone, which includes Santa Ana, the Maher zone, as well as indicating a significant footprint at Gibson and the areas surrounding the deep 3D spectral IP inversion of CSEM-MT "Donut" shape anomaly. The soil samples appear to validate the geophysics data, and together they suggest two large, porphyry copper systems: Central Zone and the Northwestern Area just north of the Gibson Mine."
Dan Weir also adds: "Unlike the adjacent Resolution Mine where mineralization begins at ~1,200 m depth, the Central Zone Targets are exposed at surface - evidenced by the mapping and channel sampling programs underway. This significantly reduces drilling costs, time to discovery and capital intensity of early exploration and is a rare advantage in a Tier-1 porphyry district. This alignment across geochemistry, geophysics, and geology significantly reduces exploration risk. The deep "donut" geophysics responses, large magnetic low, soil anomalies and preliminary geologic results in the Northwestern Area suggest the target is below the Pinal Schists, implying a preserved porphyry system at moderate depth closer to the property boundary with Resolution in the western half of the property."
Important points to note in this press release:
- The soil samples, both Copper and Molybdenum, values were higher than expected.
- The soil samples validate the Geophysics previously press released on May 12, 2026.
- We staked an additional 2,000 acres to the southeast due to the soil sample results.
- Coyote Copper is starting additional soil sampling, drone mag, and geophysics programs, focusing on the Northeast, and Southeast parts of the project.
Figures below compare the Magnetic / 3D spectral IP inversion of CSEM-MT geophysical surveys along side of the Copper soil samples
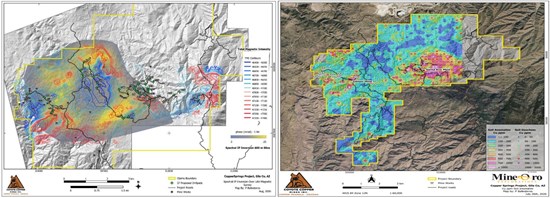
To view an enhanced version of this graphic, please visit:
https://images.newsfilecorp.com/files/8516/307940_coyote1.jpg
Program Summary
Soil Sampling - Figures 1, 2 and 3:
- 1,606 soil samples collected (Phase 1 & 2):
- Program conducted January-April 2026
- 880 additional samples planned for Phase 3:
- 431 completed to date and delivered to Skyline Laboratories in Tucson, AZ
- Remaining soils to be completed by the end of August
- Sampling covers the Central Zone (Santa Ana-Maher), Gibson, and areas surrounding the large geophysical donut anomaly
- Soil sampling is being done at 200m spacing:
- Infill sampling at 100m and 50m spacing is being carried out as appropriate
Soil sampling provides a practical tool for prioritizing follow-up field geologic mapping/sampling.
Copper soil anomalies form broad, coherent kilometre-scale clusters rather than isolated highs. These clusters coincide with mapped alteration zones and the geophysical donut feature, indicating:
In the Central Zone:
- A multi-kilometre porphyry - style hydrothermal footprint
- Circular area of strong copper fertility across three kilometres
- Near-surface mineralization consistent with the upper levels of a porphyry system
In the Northwest area:
- Evidence of propyllitic alteration in the Pinal Schists
- Evidence of copper - moly veins and specularite veining in the Pinal Schists
- 2.5 Kilometre - long oval magnetic low
The presence of >1,000 ppm Cu in soils across several zones is highly significant in porphyry exploration, especially in areas with limited outcrop.
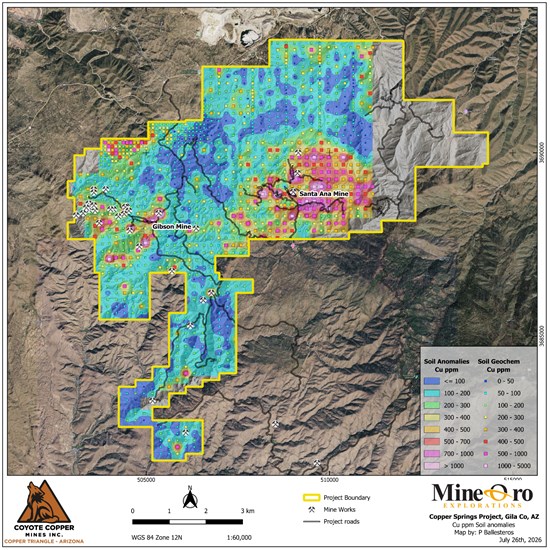
Figure 1 - Copper (Cu) in soils
To view an enhanced version of this graphic, please visit:
https://images.newsfilecorp.com/files/8516/307940_15567cd1048118e1_003full.jpg
The Central Zone exhibits a 3 km-diameter copper anomaly (values exceeding 500 ppm Cu) that contains two discrete 1 km-diameter molybdenum anomalies (values exceeding 15 ppm Mo). New targets have been identified, and follow-up sampling programs are being planned.
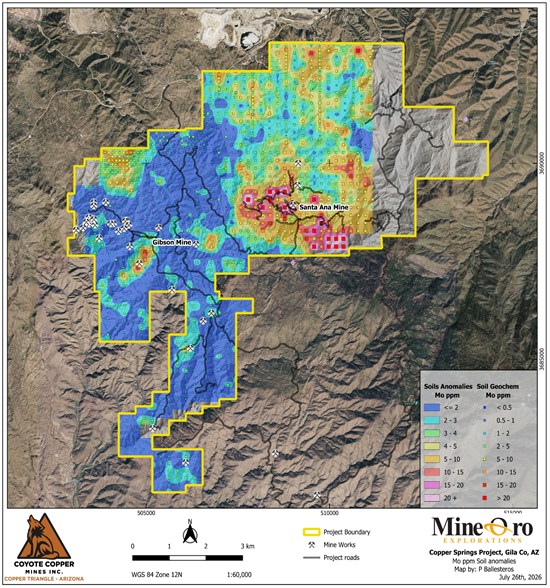
Figure 2. Molybdenum (Mo) in soils
To view an enhanced version of this graphic, please visit:
https://images.newsfilecorp.com/files/8516/307940_15567cd1048118e1_004full.jpg
Molybdenum anomalies are widespread and locally intense. Elevated Mo values (>10 ppm) are particularly important because Mo is:
- A diagnostic indicator of porphyry copper systems
- Typically associated with the deeper, more mineralized portions of porphyry intrusions
- A strong predictor of system size and fertility
The combination of strong Cu and Mo anomalies across multiple zones materially strengthens the interpretation of a large, porphyry system - refer to Figures 1 (Cu in soils) and 2 (Mo in soils), and Figure 3 (additional soil sampling)
Copper concentrations across the 1,606 soil samples ranged from 2.6 ppm to 2,660 ppm (0.266%). A well-defined circular copper anomaly (3 by 3km) is centered on Santa Ana Zone, and which coincides with a shallow chargeability feature identified in historic geophysical data, and is related to a shallow donut outlined in the recent 3D spectral IP inversion of CSEM-MT.
Molybdenum values ranged from below detection limits to 59 ppm, averaging 3.24 ppm. Elevated concentrations occur in several other zones which correspond to surface mineralization.
The Central Zone Molybdenum-in-soils anomaly extends approximately 2 km × 1 km and corresponds to a Cu-Mo stockwork hosted in porphyry intrusives, Pinal Schist, and Madera Diorite. The vein assemblage is dominated by Type-J, Type-K, Type-L (quartz veins with chalcopyrite blebs), and BMQ (banded molybdenite-quartz) veins, is part of a well-developed Cu-Mo porphyry-related hydrothermal system.
In surface environments, copper is readily oxidized and mobilized, frequently producing supergene enrichment, whereas molybdenum remains relatively immobile under chemical weathering. Consequently, porphyry copper systems commonly display a molybdenum core enclosed by a copper halo in their geochemical footprint.
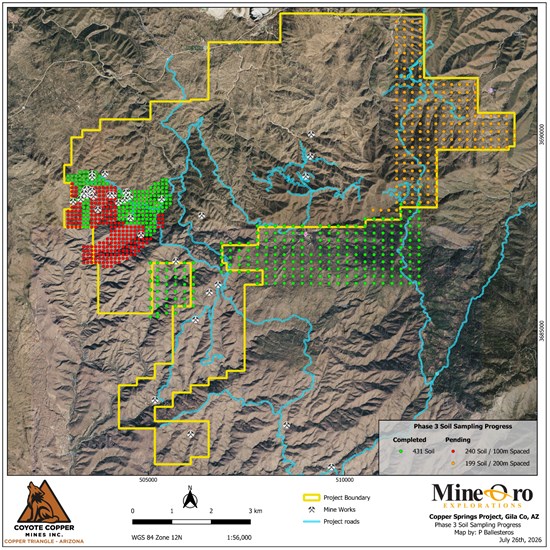
Figure 3. Additional soils sample (Phase 3 campaign)
To view an enhanced version of this graphic, please visit:
https://images.newsfilecorp.com/files/8516/307940_15567cd1048118e1_005full.jpg
Claim Staking
The recent claim acquisition is strategically important, as it covers the projected extensions of several significant copper and molybdenum soil anomalies. It secures the southeastern continuation of the Santa Ana mineralized corridor, as well as the southeastern extensions of the Gibson target areas - refer to Figure 4 (Claim staking)
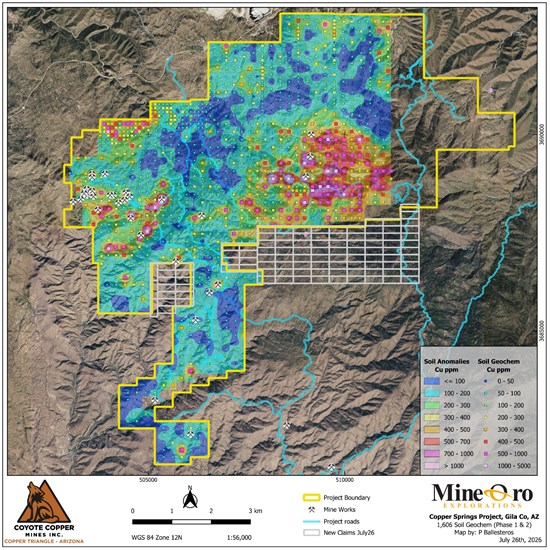
Figure 4. Claim staking
To view an enhanced version of this graphic, please visit:
https://images.newsfilecorp.com/files/8516/307940_15567cd1048118e1_006full.jpg
Geology and Surface Mapping Program
Mapping, Structural Analysis, and Channel Sampling are being carried out in the new Central Zone, where strong quartz-chalcopyrite millimeter to centimetric vein stockwork mineralization outcrops over 350m of exposure.
Data Compilation, Synthesis and Interpretation
The May 12, 2026, geophysical news release outlined a multi-kilometre donut-shaped magnetic low surrounded by 3D spectral IP inversion of CSEM-MT anomalies - a classic signature of magnetite-destructive phyllic alteration and sulphide-rich shells.
The soil geochemistry now directly confirms this geometry.
Independent datasets all outline the same porphyry-scale footprint:
- Drone Magnetics - refer to Figure 5:
- Large, coherent magnetic low at centre
- 3D Induced Polarization ("IP") Survey:
- Shallow chargeability high on two historic lines
- Controlled Source Electromagnetics ("CSEM") and Magneto-telluric ("MT") surveys:
- Deep conductivity contrasts creating the Geophysical Donut geometry - refer to Figures 6, 7 and 8
- Hyperspectral Imaging:
- Lower temperature Propylitic halo surrounding a Potassic core
- Potassic alteration forms in the inner core of a porphyry system, where temperatures are highest and fluids are K-rich:
- It is the most economically important alteration type because it commonly hosts chalcopyrite ± bornite Cu mineralization as seen in Central Zone
- Propylitic alteration forms the outer, cooler halo of the porphyry system:
- It is widespread and typically surrounds phyllic and potassic zones
- Extremely important for vectoring towards Cu-Mo mineralization
- Was identified in the Pinal Schists in the Northwestern Area
- Geological Mapping confirms a multi-kilometric hydrothermal system:
- Multi-generation breccias, phyllic / propylitic alteration, multiple intrusive phases, pyrite-chalcopyrite mineralization
- These features are consistent with the upper and lateral portions of a porphyry system, and their distribution corresponds to the geophysical footprint of the Northwestern Area, at depth, and the shallow Central Area
Why the Geophycial Donut Matters
The "Donut" anomaly - similar to features used by BHP in global porphyry targeting - indicates:
- Large Alteration System = Large Tonnage Potential:
- The scale of the donut exceeds the 2-3 km diameter commonly referenced in BHP's work in Chile and Serbia
- Multi-Phase Porphyry Architecture Magnetic lows, chargeability highs, conductivity contrasts, and hyperspectral halos all match the expected geometry of a large porphyry centre
- Near-Surface Targets - unlike the adjacent Resolution Mine (mineralization begins at ~1,200 m depth):
- Central Zone targets begin at or near surface, reducing drilling cost and accelerating discovery
When multiple geophysical and geological datasets align on the same geometry, the probability of a significant mineralized system increases substantially.
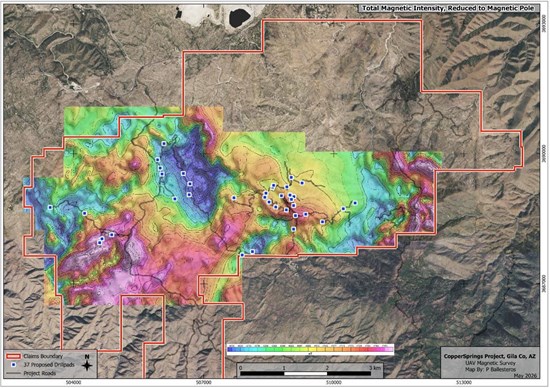
Figure 5. Drone Magnetics survey. The large blue area in the center is a magnetic low, defining the centre of a "donut". Total Magnetic Intensity Map with claim outline, roads, and drill pads indicated.
To view an enhanced version of this graphic, please visit:
https://images.newsfilecorp.com/files/8516/307940_cccm4.jpg
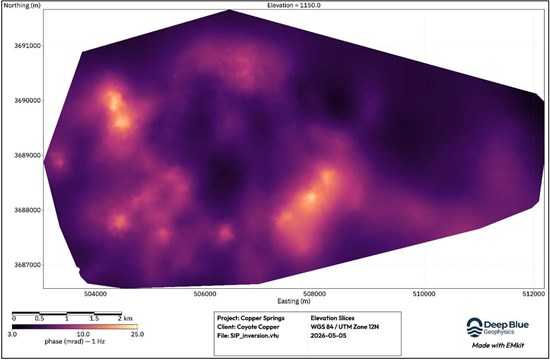
Figure 6. Geophysical Donut Anomaly from 3D Spectral IP Inversion of Controlled Source Electromagnetics ("CSEM") and Magneto-telluric ("MT") surveys showing deep conductivity contrasts defining the Geophysical Donut geometry from -300m depth
To view an enhanced version of this graphic, please visit:
https://images.newsfilecorp.com/files/8516/307940_cccm5.jpg
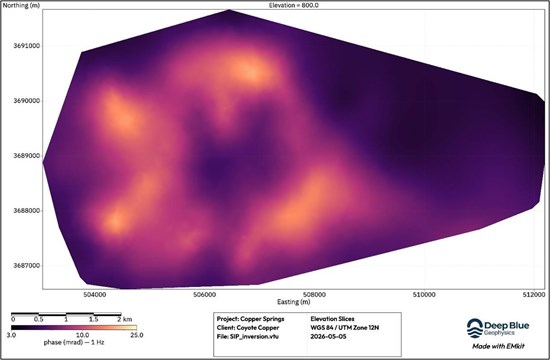
Figure 7. Geophysical Donut Anomaly from 3D Spectral IP Inversion of Controlled Source Electromagnetics ("CSEM") and Magneto-telluric ("MT") surveys showing deep conductivity contrasts defining the Geophysical Donut geometry from -650m depth
To view an enhanced version of this graphic, please visit:
https://images.newsfilecorp.com/files/8516/307940_cccm6.jpg
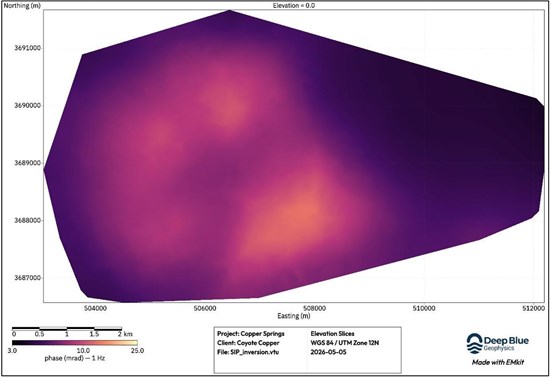
Figure 8. Geophysical Donut Anomaly from 3D Spectral IP Inversion of Controlled Source Electromagnetics ("CSEM") and Magneto-telluric ("MT") surveys showing deep conductivity contrasts defining the Geophysical Donut geometry from -1,450m depth
To view an enhanced version of this graphic, please visit:
https://images.newsfilecorp.com/files/8516/307940_cccm7a.jpg
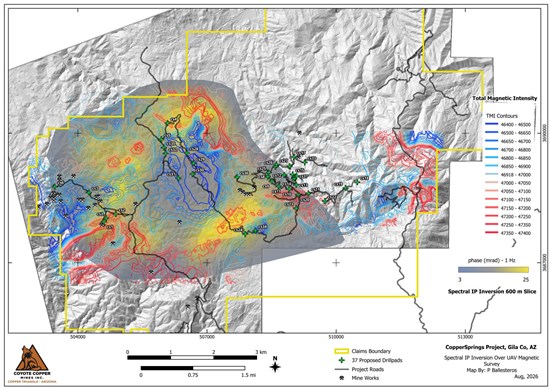
Figure 9. Overlay of the Geophysical Donut Anomaly from Controlled Source Electromagnetics ("CSEM") and Spectral IP ("SIP") surveys showing deep conductivity contrasts matching the Geophysical Donut geometry from -600m depth with the Drone Magnetics survey overlayed.
To view an enhanced version of this graphic, please visit:
https://images.newsfilecorp.com/files/8516/307940_15567cd1048118e1_011full.jpg
Technical Parameters
Soil samples were collected by Mineoro contractors under the guidance of the QP and in accordance with Mineoro protocols. The B and C soil horizons were sampled and screened to pass 60 mesh. Screened samples of approximately 400 grams are placed in pre-labeled cloth bags and sealed immediately upon collection to maintain sample integrity and security. Samples are subsequently submitted under secure chain-of-custody procedures to the laboratory for analysis. Quality control measures included the systematic insertion of certified reference standards and field duplicates at a rate of approximately 5%.
Geochemical analyses were performed by independent commercial laboratories holding ISO/IEC 17025:2017 accreditation. Multi-element analysis via aqua regia digestion (ALS Code ME-MS41) was selected for partial-extraction targeting sulphide and volatile mineralization, while 4-acid digest multi-element analysis (American Assay Laboratories 52-element suite) was utilized for near-total matrix breakdown. Both laboratories maintain comprehensive internal Quality Assurance/Quality Control (QA/QC) programs incorporating certified reference materials (CRMs), analytical blanks, and duplicate split analyses within each analytical batch to ensure verifiable data precision and accuracy
Qualified Person
Michael N. Feinstein, PhD, CPG, is the "Qualified Person" under National Instrument 43-101-Standards of Disclosure for Mineral Projects, and he has reviewed and approved the scientific and technical disclosure contained in this press release and is independent of the Issuer.
For more information, please contact:
Dan Weir, CEO
Coyote Copper Mines Inc.
[email protected]
Tel: +1-416-720-0754
Neither the Exchange nor its Regulation Services Provider (as that term is defined in the policies of the Exchange) accepts responsibility for the adequacy or accuracy of this release.
This news release does not constitute an offer to sell or a solicitation of an offer to buy any of the securities in the United States. The securities have not been and will not be registered under the United States Securities Act of 1933, as amended (the "U.S. Securities Act") or any state securities laws and may not be offered or sold within the United States or to U.S. persons unless registered under the U.S. Securities Act and applicable state securities laws or an exemption from such registration is available.
Cautionary Statement Regarding Forward Looking Information
This news release contains statements which constitute "forward-looking information" within the meaning of applicable securities laws, including statements regarding the plans, intentions, beliefs and current expectations of the Corporation.Often, but not always, forward-looking information can be identified by the use of words such as "plans", "expects", "is expected", "budget", "scheduled", "estimates", "forecasts", "intends", "anticipates", or "believes" or variations (including negative variations) of such words and phrases, or statements formed in the future tense or indicating that certain actions, events or results "may", "could", "would", "might" or "will" (or other variations of the forgoing) be taken, occur, be achieved, or come to pass. Forward-looking information includes information regarding the commencement of trading of the Resulting Issuer Shares, the business plans and expectations of the Corporation and expectations for other economic, business, and/or competitive factors. Forward-looking information is based on currently available competitive, financial and economic data and operating plans, strategies or beliefs as of the date of this news release, but involve known and unknown risks, uncertainties, assumptions and other factors that may cause the actual results, performance or achievements of the Corporation to be materially different from any future results, performance or achievements expressed or implied by the forward-looking information. Such factors may be based on information currently available to the Corporation including information obtained from third-party industry analysts and other third-party sources, and are based on management's current expectations or beliefs. Any and all forward-looking information contained in this news release is expressly qualified by this cautionary statement.
Investors are cautioned that forward-looking information is not based on historical facts but instead reflect management's expectations, estimates or projections concerning future results or events based on the opinions, assumptions and estimates of management considered reasonable at the date the statements are made. Forward-looking information reflects management's current beliefs and is based on information currently available to them and on assumptions they believe to be not unreasonable in light of all of the circumstances. In some instances, material factors or assumptions are discussed in this news release in connection with statements containing forward-looking information. Such material factors and assumptions include, but are not limited to receipt of final listing approval from the Exchange, together with the factors referenced in this news release and Filing Statement, including, but not limited to, those set forth in the Filing Statement under the caption "Risk Factors". Although the Corporation has attempted to identify important factors that could cause actual actions, events or results to differ materially from those described in forward-looking information, there may be other factors that cause actions, events or results to differ from those anticipated, estimated or intended. Forward-looking information contained herein is made as of the date of this news release and, other than as required by law, the Corporation disclaims any obligation to update any forward-looking information, whether as a result of new information, future events or results or otherwise. There can be no assurance that forward-looking information will prove to be accurate, as actual results and future events could differ materially from those anticipated in such statements. Accordingly, readers should not place undue reliance on forward-looking information.
Should one or more of these risks or uncertainties materialize, or should assumptions underlying the forward-looking information prove incorrect, actual results may vary materially from those described herein as intended, planned, anticipated, believed, estimated or expected. Although the Corporation has attempted to identify important risks, uncertainties and factors which could cause actual results to differ materially, there may be others that cause results not to be as anticipated, estimated or intended. The Corporation does not intend, and does not assume any obligation, to update this forward-looking information except as otherwise required by applicable law.
Appendix
Zonge International completed the field work for the CSEM/SIP
Zonge International Acquired CSEM/SIP and broadband MT data on the Copper Springs Project on a 3D grid. Vector stations of Ex, Ey were planned and setup at 59 stations. Roughly half of the stations measured Hx, Hy magnetic fields. 14 transmitter dipoles are planned to be read from 7 transmitter locations.
The transmitted signal was a 100-percent duty-cycle square wave. Initial base frequencies were 0.125, 1, 8, and 64 Hz. Total read time was approximately 2 hours per transmitter dipole.
All MT data was acquired from 0.01-1,024Hz, the data was collected before and after the CSEM/SIP reads. All data was acquired at 4096 samples per second.
A distant remote reference site was deployed. The remote site was deployed away from powerlines, pipelines, and other cultural electromagnetic sources to the extent possible. A location to the SE of the grid was chosen.
ZONGE surveyed the station locations and wire path using Garmin 64s Handheld GPS.
All acquired field data was checked through a QA/QC review and processed daily using the Zonge CSEM and MT Processing workflow. The data was processed in two large batches. One about halfway through the project and once at the end.
Instrumentation consisted of ZONGE broadband ZEN receivers. Magnetic field data was acquired with ZONGE ANT-4 low frequency broadband induction feedback coils. There will be spare receivers on site if possible. The receiver electrodes will consist of rusted steel plates.
The source for the CSEM/SIP data was a Zonge GGT-10, 10 KVA transmitter system. Multiple systems were utilized to minimize delays between transmitter reads If 90% of the source-receiver combinations and 90% of the MT soundings were successfully acquired without equipment failure or operator error.
Zonge Engineering - Drone Magnetic Survey
Zonge covered an area of 33 km2, with lines-oriented east-west at 50-meter line spacing. The approximate total coverage is 650 line-km.
Magnetic data was acquired using a Drone-based magnetometer system. The magnetic system comprises a Geometrics MagArrow cesium vapor total-field scalar magnetometer. The platform is a battery-operated DJI Matrice 300 RTK quadcopter. The magnetometer will be attached to the drone using 3-meter suspension cables. GPS positions and total field intensity data are recorded continuously at a sample rate of 1000 Hz and reduced to 10 Hz during post-processing. Drone speed will be set between 8 and 9 m/s, depending on the terrain. The 10 Hz data sampling interval, acquired at a speed of 9 m/s, yields approximately 1 m data points along flight lines. Flight altitude will be 50m AGL. The line locations are subject to change based on flight logistics, terrain, ground access, and the UAV's line of visual sight.
Flight paths were planned using Universal Ground Control Station terrain following software and uploaded to the UAV prior to each flight. Elevation data for flight altitude control will be sampled from USGS LiDAR terrain data.
High winds or sudden gusts of wind can cause a pendulum motion in the tow cable, which could set the sensor out of proper orientation. The Geometrics MagArrow has two Micro-Fabricated Atomic Magnetometer (MFAM) sensors ensuring that when one sensor is in its dead zone the other is at its optimum orientation. This avoids reading dropouts during the survey. The MagArrow has a 5nT heading error, which will be compensated for by flying a calibration flight. Data was compensated using software developed by Geometrics.
A base magnetometer recorded continuously at a fixed ground location to allow for diurnal corrections.
Deep Blue Geophysics - Interpretation of Zonge's Data
Deep Blue Geophysics LLC (Deep Blue) completed specialized Data Quality Assurance/Quality Control (QAQC) and advanced 3D inversion services, for CCMM. This project focused on the integration of broadband Controlled-Source Electromagnetic (CSEM) and Magnetotelluric (MT) data collected by Zonge at the Copper Springs site.
Deep Blue performed a rigorous audit of all Zonge deliverables to ensure the highest data integrity before modeling. This included:
CSEM Analysis: Inspection of response data for each transmitter-receiver pair to ensure signal quality.
MT Analysis: Systematic review of MT response data for each receiver station to identify and mitigate environmental noise or artifacts.
Joint 3D Spectral IP Inversion Deep Blue employed proprietary DeepBlueEM3D platform to conduct a sophisticated 3D Spectral IP inversion, providing a 3D model of resistivity and chargeability. This workflow integrates the CSEM and MT data to provide a unified subsurface model.
Integrated Dataset: Zonge CSEM and MT data was collected at approximately 59 receiver stations using 7 transmitter dipoles
Modeling Parameters: Inversions utilized a frequency range of 0.125 Hz to 1000 Hz to resolve spectral IP (resistivity amplitude and phase).
Staged Modeling Workflow: 1. Stand-alone 3D inversion of MT data. 2. Stand-alone 3D inversion of CSEM data. 3. Joint 3D inversion of the combined MT-CSEM dataset.
Objective: Interpretation & Drill Targeting Following the inversion process, Deep Blue collaborated with Coyote Copper Mines to interpret the 3D volumes. This phase ensures that geophysical anomalies are cross-referenced with geological context to provide prioritized recommendations for future drill-hole locations.
To view the source version of this press release, please visit https://www.newsfilecorp.com/release/307940
Source: Coyote Copper Mines Inc.